Compound Interest Calculator — Plan Long-Term Investment Growth
The Math Behind Building Wealth
Compound interest means earning interest on your interest — not just on the money you put in. Over long periods, this creates exponential growth that many people underestimate until they see the numbers.
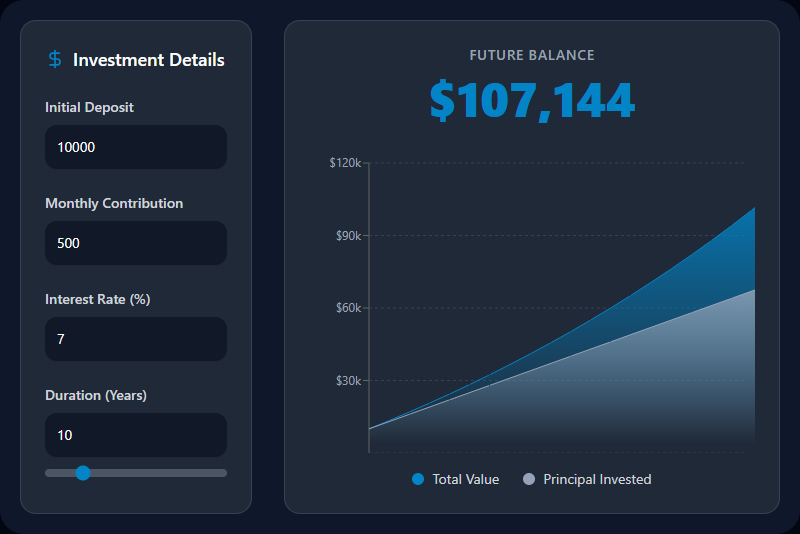
This calculator lets you model different scenarios: a starting amount, regular monthly contributions, an expected annual return, compounding frequency, and how many years you'll stay invested. The output shows your future value broken into what you contributed versus what the compounding effect added.
The Formula
Lump sum only (no contributions):
FV = P × (1 + r/n)^(n×t)
With monthly contributions:
FV = P × (1 + r/n)^(n×t) + PMT × [((1 + r/n)^(n×t) − 1) / (r/n)]
Where:
- P = Starting principal
- r = Annual interest rate (as a decimal, e.g., 0.10 for 10%)
- n = Compounding periods per year (12 for monthly)
- t = Time in years
- PMT = Monthly contribution amount
A Concrete Example: Starting Early vs. Starting Late
| Scenario | Start | Monthly Contribution | Years | Rate | Total Invested | Final Value |
|---|---|---|---|---|---|---|
| Early start | Age 25 | ₹5,000 | 35 years | 10% | ₹21,00,000 | ₹1,89,00,000 |
| Late start | Age 35 | ₹5,000 | 25 years | 10% | ₹15,00,000 | ₹66,00,000 |
| Catching up | Age 35 | ₹10,000 | 25 years | 10% | ₹30,00,000 | ₹1,31,00,000 |
The person who started at 25 invested ₹6 lakh less but ended with almost three times more due to the additional 10 years of compounding. The person starting at 35, even doubling their contributions, couldn't match the outcome.
This is why time is the most powerful variable in the equation.
Compounding Frequency: Does It Matter?
| Frequency | Effect |
|---|---|
| Annually | Interest calculated once per year |
| Quarterly | Each quarter's interest added for the next quarter to earn on |
| Monthly | Standard for most bank accounts, SIPs, and mutual funds |
| Daily | Common for savings accounts — marginal difference from monthly |
For most practical planning purposes, monthly compounding is the standard assumption. The difference between monthly and daily compounding is usually less than 0.1% over typical investment horizons.
What Return Rate Should You Use?
| Asset Class | Historical Annual Return | Risk Level |
|---|---|---|
| Savings account | 3–6% | Negligible |
| Fixed deposit / Bonds | 6–8% | Very Low |
| Debt mutual funds | 7–9% | Low |
| Balanced / hybrid funds | 10–12% | Medium |
| Index funds (Nifty 50) | 12–14% (long-term avg.) | Medium |
| Diversified equity | 12–15% | Medium-High |
| Small cap equity | 15–20% (with high volatility) | High |
For planning purposes, conservative planners use 8% for estimates; aggressive planners use 12%. Running both gives you a realistic range rather than a single optimistic number.
Common Planning Scenarios
Building a retirement corpus: Model the monthly investment needed over 25–30 years to reach a target corpus at retirement. Use this alongside the SIP Calculator for equity-focused retirement planning.
Education fund: A child starting school in 12 years needs ₹15 lakhs for college. What monthly investment at 10% gets you there? (Answer: approximately ₹5,800/month)
Emergency fund growth: Calculate how a 6-month emergency fund in a savings account at 5% grows over 5 years, even without adding to it.
Goal-based saving: "I want ₹25 lakhs in 10 years for a home down payment. I have ₹3 lakhs now. At 8% return, how much do I need to invest monthly?" — this calculator answers instantly.
Limitations
Assumes a constant return rate. Real investment returns fluctuate — some years strongly positive, some negative. The calculated future value is a projection at the stated average rate, not a guarantee.
Inflation is not factored in. The future value shown is in nominal terms. To get the real purchasing power, subtract expected inflation (3–7%) from your assumed return rate. A 10% return in a 5% inflation environment is a 5% real return.
No tax deduction. Returns from equity mutual funds, savings accounts, and fixed deposits are taxable in most jurisdictions. Actual after-tax returns will be lower than the gross rate used in the calculation.
Contribution timing assumption. The formula assumes contributions are made at the end of each period (ordinary annuity). If you invest at the start of each period (annuity due), the final value is marginally higher.
Related Finance Tools
- SIP Calculator — Model mutual fund SIP growth specifically
- EMI Calculator — Calculate the cost of borrowing vs. the benefit of investing
- Loan Eligibility Calculator — Estimate how much you can borrow
- ROI Calculator — Compare returns across different investment types
- Percentage Calculator — Quick percentage math for any financial scenario
Recommended schema: SoftwareApplication + FAQPage + CalculatorApp