BMI Calculator — Check Your Body Mass Index Free (Metric & Imperial)
Your BMI in 5 Seconds — No Account, No Tracking
BMI isn't a diagnosis. But it's the most universally used first-step screening measurement for weight-related health risk — recognised by the WHO, used in medical intake forms worldwide, and referenced by insurance assessors in dozens of countries.
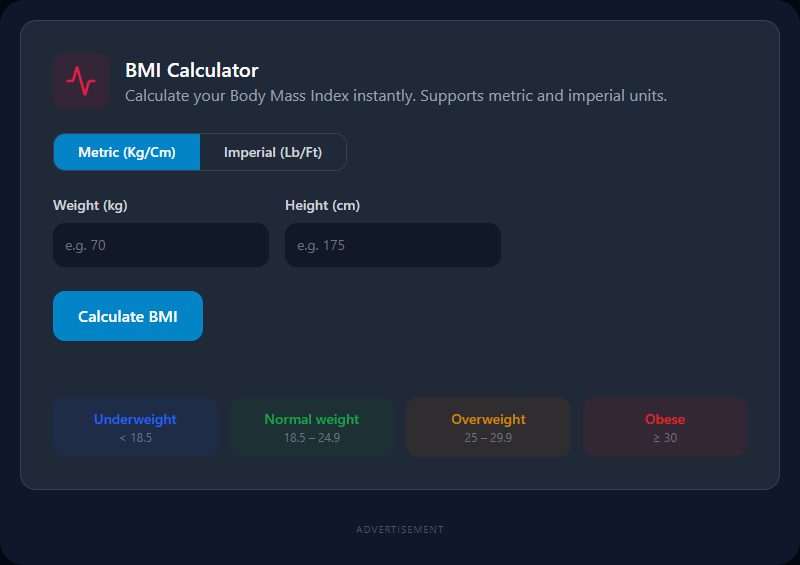
This calculator gives you your BMI instantly using the standard WHO formula, supports both metric and imperial units, and shows your result on a visual gauge alongside the official health category. All calculations happen in your browser — your height and weight are never stored or transmitted.
The BMI Formula (Both Unit Systems)
Metric system (kg and cm):
BMI = weight (kg) ÷ (height in metres)²
Example: 70 kg, 175 cm → BMI = 70 ÷ (1.75)² = 70 ÷ 3.0625 = 22.86
Imperial system (lb and inches):
BMI = 703 × weight (lb) ÷ (height in inches)²
The 703 constant converts the result to match the metric scale exactly. The formula is otherwise identical.
Why height is squared: Without squaring, taller people would always have proportionally higher BMIs simply due to height — not body mass. Squaring height creates a scale where the ratio becomes approximately independent of height, making it comparable across different heights.
WHO BMI Classification Table
| BMI Range | Category | Interpretation |
|---|---|---|
| Below 18.5 | Underweight | May indicate nutrient deficiency, low bone density |
| 18.5 – 24.9 | Normal weight | Evidence-based healthy weight range for most adults |
| 25.0 – 29.9 | Overweight | Elevated risk of metabolic conditions |
| 30.0 – 34.9 | Obese (Class I) | High risk; lifestyle intervention typically recommended |
| 35.0 – 39.9 | Obese (Class II) | Very high risk; medical attention may be needed |
| 40.0 and above | Obese (Class III) | Severely elevated health risk |
These thresholds come from the WHO Global Database on Body Mass Index and are used as a population-level screening reference globally.
Adjusted Ranges for South Asian Populations
For South Asian, Southeast Asian, and East Asian populations, health risks associated with excess body fat appear at lower BMI thresholds. Some health bodies and national guidelines recommend adjusted cutoffs:
| Category | Standard WHO | Adjusted (South/East Asian) |
|---|---|---|
| Normal | 18.5 – 24.9 | 18.5 – 22.9 |
| Overweight | 25.0 – 29.9 | 23.0 – 27.4 |
| Obese | ≥ 30.0 | ≥ 27.5 |
Research shows that at the same BMI, South Asian adults tend to carry more visceral (abdominal) fat and have higher rates of type 2 diabetes and cardiovascular disease compared to European populations.
Real-World Use Cases
Annual checkups: Calculate your BMI before a doctor's appointment to have an informed, contextual baseline ready for discussion rather than hearing the number cold for the first time.
Fitness goal tracking: Weigh yourself monthly and track BMI alongside other metrics. The trend over 3–6 months is far more informative than any single reading. Pair with waist measurements for a more complete picture.
Health insurance: Many insurance plans reference BMI in premium calculations and eligibility assessments. Knowing where you stand helps you understand your risk profile.
Gym and trainer intake: Fitness assessors commonly use BMI as a starting baseline alongside body fat percentage, cardiovascular fitness tests, and flexibility assessments.
Best Practices: Getting Useful Insights from BMI
Use BMI as a starting point, not a final verdict. An overweight BMI in an active person with good metabolic markers carries different implications than the same BMI in a sedentary person with high fasting glucose. Context matters.
Combine BMI with waist circumference. Medical researchers increasingly consider waist circumference a stronger predictor of cardiometabolic risk than BMI alone. WHO thresholds: Men >94cm (action), >102cm (high risk). Women >80cm (action), >88cm (high risk).
Consistency in measurement conditions. Weigh yourself at the same time of day (morning, before eating) on the same scale. Body weight can fluctuate by 1–2 kg within a single day based on food, fluid, and activity.
Track the trend, not the absolute number. A BMI of 25.6 today vs. 26.4 three months ago means you're moving in the right direction — more meaningful than obsessing over a single reading.
Known Limitations of BMI
Athletes and strength trainers: High muscle mass produces high weight relative to height. A lean 5'10" (178cm) bodybuilder at 200 lbs (91 kg) has a BMI of 28.6 (Overweight) despite likely having very low body fat. BMI is mass-based, not fat-based.
Elderly populations: Muscle mass decreases with age while fat may increase, especially redistributed as visceral fat. An elderly person can have a "normal" BMI while having dangerously low muscle mass — a condition called sarcopenia.
Children under 20: Standard adult BMI formulas do not apply. Pediatric BMI uses age- and sex-specific percentile charts, not absolute thresholds.
Pregnant women: BMI during pregnancy requires entirely different interpretation using gestational weight gain guidelines, not WHO adult BMI categories.
Extreme height cases: Very short individuals (under 150cm) and very tall individuals (over 200cm) may get misleading results because height's relationship to mass doesn't perfectly scale at extremes.
Related Tools
- EMI Calculator — Plan finances alongside health goals
- Calorie Calculator — Estimate calories burned by activity to complement BMI monitoring
- BMR Calculator — Calculate your Basal Metabolic Rate for daily calorie planning
- Percentage Calculator — Calculate what percentage of body weight you've changed
- Salary Tax Calculator — Other life planning calculators
Recommended schema: SoftwareApplication + FAQPage